
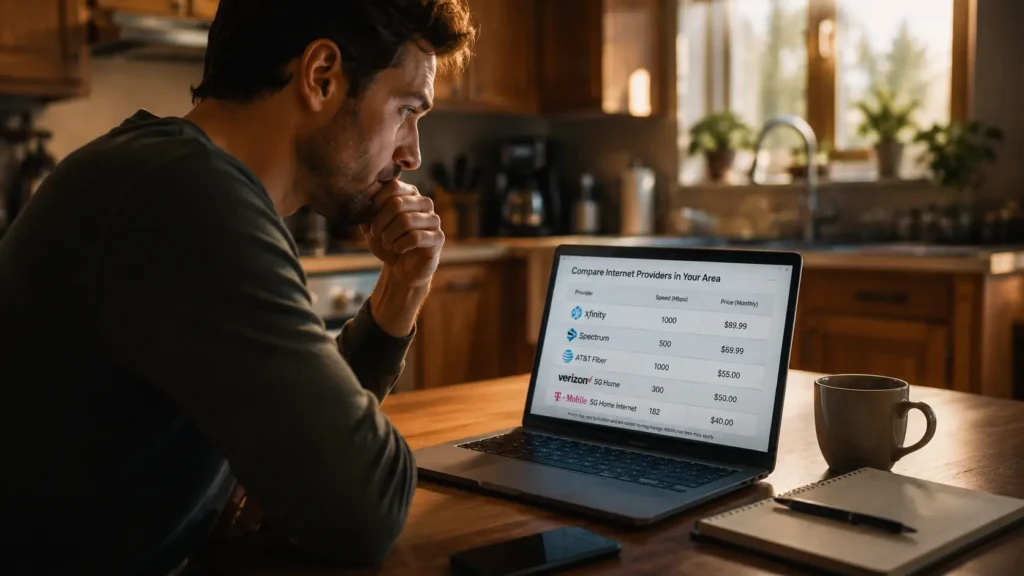
Two households, 1,200 miles apart, both subscribe to 200 Mbps internet. Both stream the same shows. Both use the same brand of router. One pays $58 a month. The other pays $115 a month for an identical service, identical speed, identical reliability.
The difference is not technology. It is not usage. It is a single variable: how many companies are competing for that household’s business.
This is the most consequential, least understood market failure in American consumer technology and the numbers behind it are larger than most people assume.
The Number That Explains Everything
A comprehensive county-level analysis of US broadband markets found that over 96% of US counties show high market concentration meaning severely limited competition in broadband services. The average market concentration score nationwide was 5,842, far above the threshold regulators consider a competitive market.
The financial consequence of that concentration is direct and measurable. The typical broadband price in the 300 least competitive counties is $269.90 for comparable service, compared to $174.23 in the 300 most competitive counties a difference of $95.67, or 35.44% higher in concentrated markets.
Crucially, this is not an infrastructure cost story. The relationship between market concentration and pricing holds even for high-speed plans of 100+ Mbps, which are typically deployed in urban and suburban areas where infrastructure costs are already lower. This challenges the common industry justification that higher prices in less competitive areas simply reflect higher deployment costs.
The price is not explained by the cost of the cable. It is explained by the absence of an alternative provider.

What “Monopoly” Actually Means Here
Over one-third of Americans have access to just one or zero broadband providers at the speeds they need. Roughly 42.2 million Americans about 13% of the US population — live in areas with zero or one fixed broadband provider offering at least 25/3 Mbps service, concentrated most heavily in rural Appalachia, the Mississippi Delta, the rural Great Plains, and Alaska.
This is not illegal. It comes down to the concept of a “natural monopoly” companies do not illegally force competitors out; it is simply prohibitively expensive to build parallel high-speed infrastructure into the same region. Once one company is entrenched with cable or fiber already in the ground, a second company has little financial incentive to duplicate that investment for the same customer base. Without a competitive threat, companies can raise prices with impunity sometimes by as much as $50 a month.
The result is what economists call price discrimination by geography not because anyone designed it that way deliberately, but because the underlying economics of laying cable make competition rare, and absence of competition reliably produces higher prices.
The Effect Is Measurable Beyond the Bill
The financial cost is only part of the picture. Monopoly markets do not just cost more they perform worse.
Monopoly markets average 41% slower download speeds than competitive markets, according to Speedtest Intelligence data. Without the threat of customer defection, ISPs in monopoly territories invest less in infrastructure upgrades many still offer DSL service running on copper telephone networks more than 40 years old, not because fiber is technically infeasible, but because the return on investment doesn’t justify the cost without competitive pressure.
The economic consequences extend further than household bills. A 2023 Federal Reserve study found that counties gaining a second broadband provider saw GDP growth 0.8 to 1.4 percentage points higher than monopoly counties over five years. Slow, expensive internet is not simply an inconvenience it measurably constrains regional economic participation, particularly in remote work.
2025 Made the Problem Structurally Worse
The most significant recent development is not a new monopoly forming it is existing competition disappearing through consolidation.
Verizon closed its $20 billion acquisition of Frontier Communications in January 2025, expanding its fiber network to 30 million homes across 31 states. Frontier had been one of the few remaining independent fiber challengers in those markets. That competitor is now gone.
In May 2025, the FCC approved Charter Communications’ $34.5 billion acquisition of Cox Enterprises a deal that created the largest cable broadband provider in the United States, covering at least 38 million customers across 41 states, with an estimated 35.9 million broadband subscribers under one company. That represents roughly one-quarter of all American households served by a single broadband provider.
The same year, the FCC permanently killed net neutrality, removing a regulatory mechanism that had when in force prevented ISPs from charging websites for “fast lane” access or throttling competing streaming services.
The pattern: at the exact moment broadband affordability had become a documented national crisis, two of the largest consolidation deals in telecom history were approved, removing the limited competitive pressure that existed in dozens of states.
Why “Just Switch to Starlink” Doesn’t Solve It
The most common counterargument that satellite and fixed wireless internet now offer competitive alternatives does not hold up at the price point that matters most.
Fixed wireless is capacity-constrained and performs worse than fiber for multi-device households and heavy users. Starlink costs $120 per month with a $599 hardware fee expensive for the rural, low-income households it is theoretically supposed to serve.
The mega-mergers of 2025 were approved during this supposed wave of new competitive alternatives meaning regulators looked at the existing competitive landscape and decided to reduce it further anyway. The argument also fails to address the core problem: in most American urban and suburban zip codes, residents still have exactly one or two cable or fiber choices, and “one or two” providers who both know they don’t need to compete aggressively for your business does not constitute a genuinely competitive market.
How This Compares Globally
The average cost of internet service in the UK is approximately $38 per month, versus approximately $68 per month in the US. A report tracking broadband costs across 28 cities in Asia, Europe, and North America found that US consumers pay significantly more for broadband than their overseas counterparts and just three US cities ranked in the top half of all cities tracked worldwide for affordability.
The structural reason other developed countries avoid this problem is instructive. The most affordable US city in that comparison Ammon, Idaho achieved that distinction specifically through an open-access, community-broadband network that enables multiple providers to compete over the same shared infrastructure, rather than requiring each provider to build duplicate cable into the ground. That structural choice shared infrastructure, competing service providers is common in parts of Europe and almost entirely absent in the US model, where the company that owns the wire typically also sells the only service running through it.
What’s Actually Being Done
The $42.5 billion BEAD program Broadband Equity, Access, and Deployment is the primary federal response, with every state receiving an allocation in 2024–2025 to fund infrastructure in unserved and underserved areas. States are currently completing selection processes, with most BEAD-funded deployments expected between 2026 and 2028.
Whether that federal investment meaningfully increases competition as opposed to simply extending the existing single-provider model into currently unserved areas will depend on how individual states structure their funded projects. A genuinely competitive outcome requires funding new entrants into already-served areas, not just extending coverage into unserved ones. So far, most state implementation plans favour the latter.
What This Means for Your Bill
If you are paying significantly more than a friend in a different city for identical internet speed, the explanation is almost never your usage pattern, your equipment, or your negotiating skill. It is the Herfindahl-Hirschman Index of your specific zip code a market concentration score that, in 96% of US counties, sits high enough to be classified as a structurally uncompetitive market.
Check how many providers actually serve your address not what the FCC’s outdated coverage maps claim, but what is genuinely available. If the honest answer is one or two, your bill is not a reflection of cost. It is a reflection of the absence of an alternative.
📌 Read Also:
- The $300 Billion Industry Built Around Your Personal Data
- How Cloudflare Stops Millions of Hackers Every Day
© AiwalaNews | Global Tech & Privacy Edition | April 2026