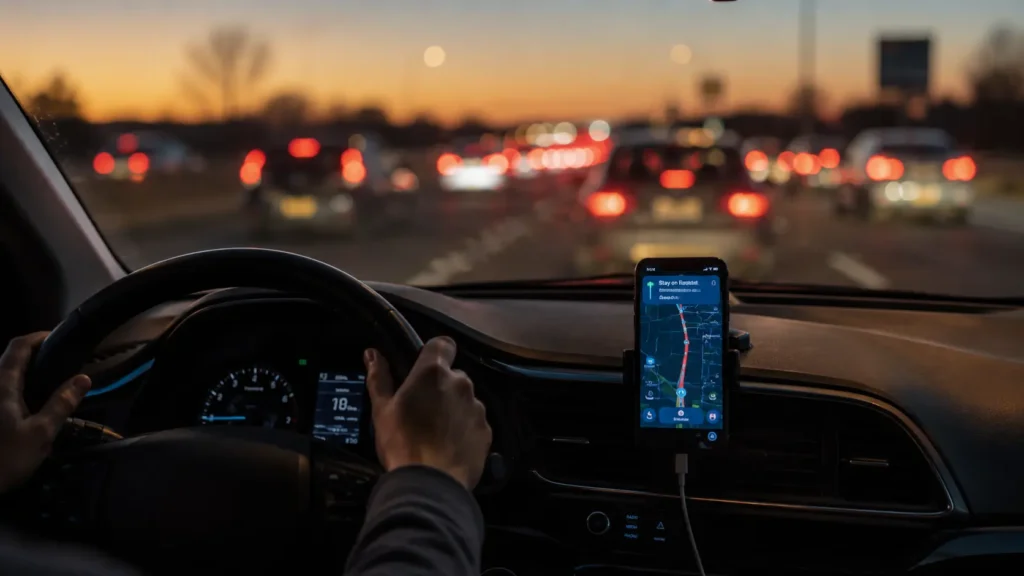
It is 8:14 a.m. on a Tuesday. A water main has just burst on the I-405 in Los Angeles. No police have arrived. No news helicopter is overhead. Not a single person has opened Waze to report it. The road has been blocked for exactly 47 seconds.
Google Maps already knows.
Not because someone told it. Not because a camera spotted it. Because 47 smartphones belonging to commuters on that stretch of highway have, in the last 90 seconds, gone from moving at 62 mph to moving at 4 mph and the algorithm noticed before any human did.
This is not a feature. This is the entire architecture. And once you understand it, you will never look at a traffic update the same way again.
You Are the Sensor
Here is the thing Google does not lead with in its marketing: Google Maps is not a map that shows you traffic. It is a crowd-sourced sensor network that happens to display a map.
Every time you use the app, you provide information about your location. When this information is analysed in bulk, Google can determine traffic conditions on roads across the entire world. By studying how your phone’s location changes over time and whether that change is slower than usual Google can determine if you’re in a traffic jam. Your data is combined with that of other users around you.
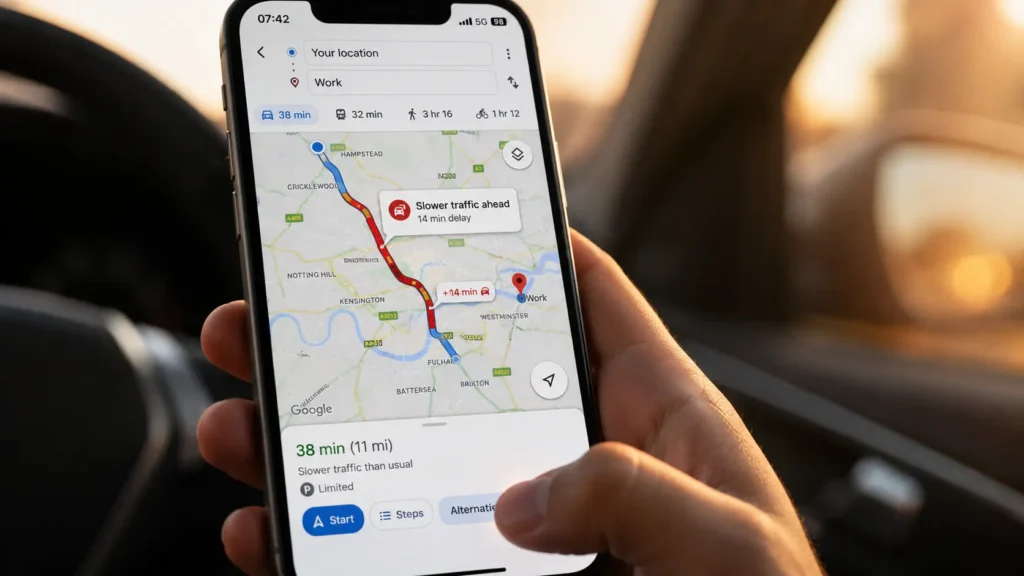
The practical example: if the normal speed on a road is 110 km/h, and Google detects that several phones on that road are moving at only 20 km/h, it deduces there is a traffic jam.
That detection does not require you to open Maps. It does not require you to report anything. It requires only that your phone has location services enabled and that you have previously agreed buried in Google’s terms of service to contribute anonymised location data. Most people did this without reading the relevant clause. Hundreds of millions of people do it every day.
Google’s real-time pipeline processes over 100 billion location pings daily across 220+ countries. One hundred billion. Per day. From phones sitting in pockets, mounted on dashboards, resting on passenger seats all of them silently reporting their speed and position, every few seconds, to Google’s servers.

The 87-Second Machine
Speed detection is step one. The intelligence layer built on top of it is where things get genuinely remarkable.
Machine learning models including spatio-temporal graph neural networks infer road segment velocity, congestion probability, and jam duration with a median latency under 92 seconds.
Let that land: from the moment phones begin slowing down on a road segment, to the moment the red line appears on Maps for every driver in the area, the median delay is under 92 seconds. In practice, the median end-to-end delay from device ping to updated jam visualisation in Maps is 87 seconds well below the 120-second threshold required for actionable rerouting.
For comparison: municipal loop detectors the sensors embedded in road surfaces by city governments average 4.2 minutes of latency and cover only 18% of US arterial roads. Traffic cameras require manual annotation or error-prone computer vision models that misclassify stopped buses as jams 23% of the time.
Google’s crowd-sourced phone network is faster than government infrastructure, covers more road, and costs Google nothing to install because you are the infrastructure.
The Three-Layer Intelligence Stack
The real-time ping data is only one of three systems running simultaneously inside every Google Maps traffic prediction.
Layer 1 – Live aggregate speed data. The phone pings described above. Density plus velocity equals a congestion probability score, updated every few minutes.
Layer 2 – Historical pattern memory. Google Maps doesn’t just rely on live data. It also remembers years of past traffic trends. If a highway always slows down at 8 AM on weekdays, Google already knows there will be delays tomorrow. This is why Google can warn you about traffic that hasn’t even started yet. The model has ingested more than a decade of mobility data. It knows that the stretch of the 101 near the Cahuenga Pass degrades every Friday after 4 p.m. It knows that school pickup creates a two-block backup on a specific residential street at 3:15 p.m. on weekdays. This institutional memory of traffic behaviour is invisible to any individual driver and impossibly difficult to replicate without population-scale data. jhu
Layer 3 – Incident reports and external feeds. Early versions of Google Maps relied on data from traffic sensors installed by government transportation agencies, using radar, active infrared, or laser radar technology to detect the size and speed of passing vehicles. Those feeds still exist, now supplemented by Waze community reports – accidents, road debris, speed traps – and official data partnerships with agencies including Transport for London and city traffic management systems across major US metros.
The three layers fuse in real time. A historical pattern says congestion is likely. Live pings confirm it is beginning. A Waze report pins the specific cause to a stalled lorry in the right lane. The result is not just a red line it is a predictive model of how long the jam will last and which alternative routes will remain viable.
The Experiment That Broke the Illusion
In February 2020, Berlin-based artist Simon Weckert did something that revealed exactly how the system works and exactly where it breaks.
Weckert rented 99 Android smartphones, installed SIM cards in each, loaded Google Maps for navigation on all of them, and placed them in a small red handcart. He then walked through the streets of Berlin at a time when traffic was sparse pulling the cart slowly through empty roads. The streets turned dark red on Google Maps. Drivers were rerouted away from roads that had no traffic at all. A virtual jam, generated by a man walking.
Weckert told CNN he came up with the idea after attending a demonstration in Berlin and noticing how people in a confined space created a “virtual traffic jam” on Maps when they were slowly moving forward.
Google’s official response was characteristically dry: “We appreciate seeing creative uses of Google Maps like this as it helps us make maps work better over time.”
What the experiment actually demonstrated was the system’s core assumption that a cluster of slow-moving phones means a cluster of slow-moving cars. A Google spokesperson confirmed: “The way Google Maps estimates traffic is by assessing the density of phones that enable the app to access their location.” The spokesperson also noted somewhat revealingly that Weckert’s experiment helps Google figure out where its geolocation needs to improve.
One obvious question the hack raises: why doesn’t a crowded bus packed with smartphones register as a traffic jam every time it stops? A bus is very easy to recognise via geolocation: a cluster of users follows a predictable path and stops in predictable places. The system has learned to classify known transit routes as non-car traffic. Weckert’s handcart had no such classification it was a novel pattern, and the algorithm defaulted to its highest-probability interpretation: congestion.
What Google Actually Knows About Your Journey
The privacy dimension of this architecture is worth sitting with for a moment.
Google’s traffic system preserves privacy through on-device anonymisation, differential privacy noise injection, and strict 7-day data retention limits. Your individual location pings are not stored as a labelled record attached to your identity. They are aggregated, anonymised, and discarded within a week.
But the system does know in real time the speed and approximate location of every phone contributing data. And contributing data is the default state for every Android device and every iPhone with Google Maps installed and location services enabled.
Weckert noted in an interview: “Even if you don’t have location services on, or you’re not using the app, data is still being collected.” The precise boundaries of passive versus active collection are not fully public.
What is clear is that the traffic accuracy you benefit from every morning commute is directly subsidised by the location data you generate and that the people around you contribute by simply driving with their phones in their pockets, whether or not they ever opened Maps that day.
The Accuracy Number
Google’s system achieves 94.1% precision and 91.8% recall for severe congestion defined as 25 mph or more below free-flow speed on highways and major arterials, validated against ground-truth Bluetooth MAC address tracking in independent studies.
For most drivers, the practical result is a system that knows about traffic jams faster than the radio, faster than city sensors, faster than police dispatch, and in the case of that burst water main at 8:14 a.m. on a Tuesday faster than any human being on the road.
Because the people stuck in it are the ones who told it. They just didn’t realise they were reporting anything at all.
📌 Read Also:
- The Shadow Profile Facebook Has on You — Even If You’ve Never Had an Account
- The $300 Billion Industry Built Around Your Personal Data
© AiwalaNews | Global Tech & Privacy Edition | April 2026